
I’ve always been drawn to the really big and the really small. From astrophysics and cosmology to particle physics and quantum mechanics.
I am fascinated about what happens at the edges of reality. I started wondering about the elements beyond 120 when I was a little boy and the structure of those nuclei and their break-downs. I read frontier articles on astronomy and wondered what a 6-star system would be like. The books and the series 3-body-problem explore that. Then the exoplanets started cropping up, then pouring in. I’ve been following that frontier ever since.
It’s also interesting to zoom in and out in mathematics, so fractals caught my eye.
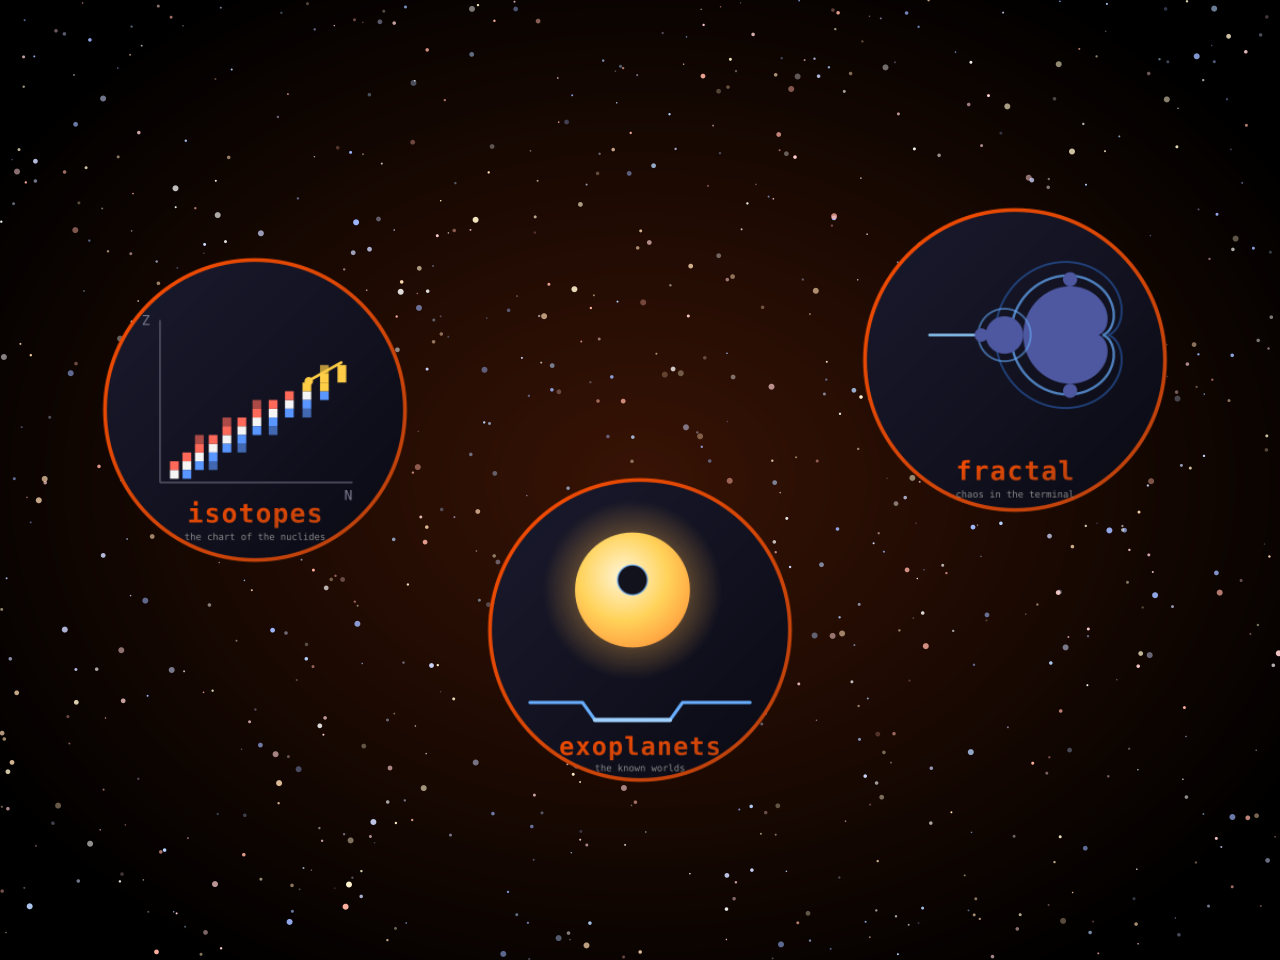
So, here we are; Three more TUI apps in the science category.

isotopes
The chart of the nuclides. Neutrons run across, protons up, one cell per nuclide, 3,386 of them. The valley of stability is not drawn in. It falls out of the data, the way the main sequence falls out of an HR diagram.
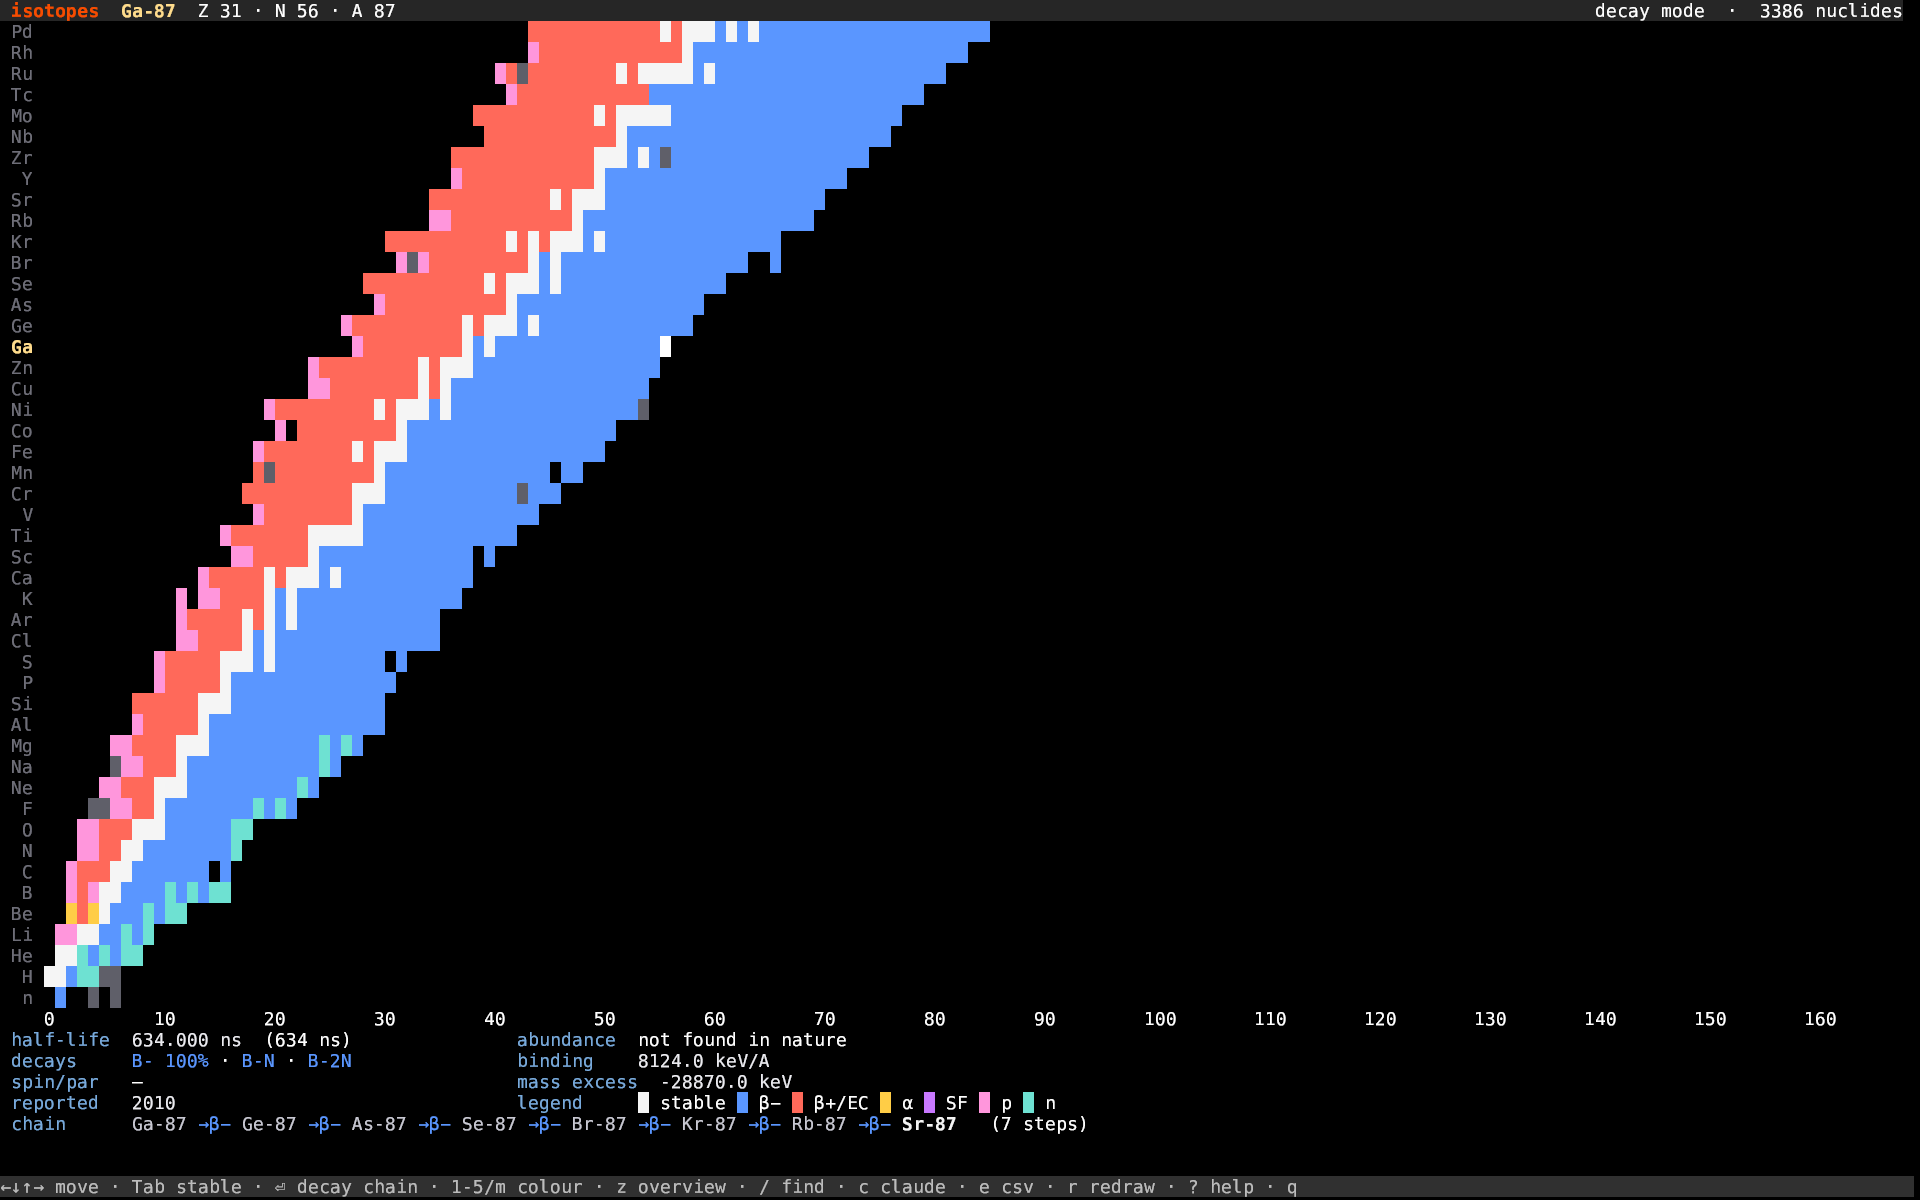
Colour by decay mode and the chart sorts itself. White down the middle where the stable ones sit. Blue below for the neutron-rich, red above for the proton-rich, gold at the heavy end where alpha takes over.
Five colour modes in all. Half-life over 26 decades. Binding energy, where the iron peak is right there in the middle. Natural abundance. The year each one was first reported, which fills the chart outward over a century.
Press Enter on uranium-238.
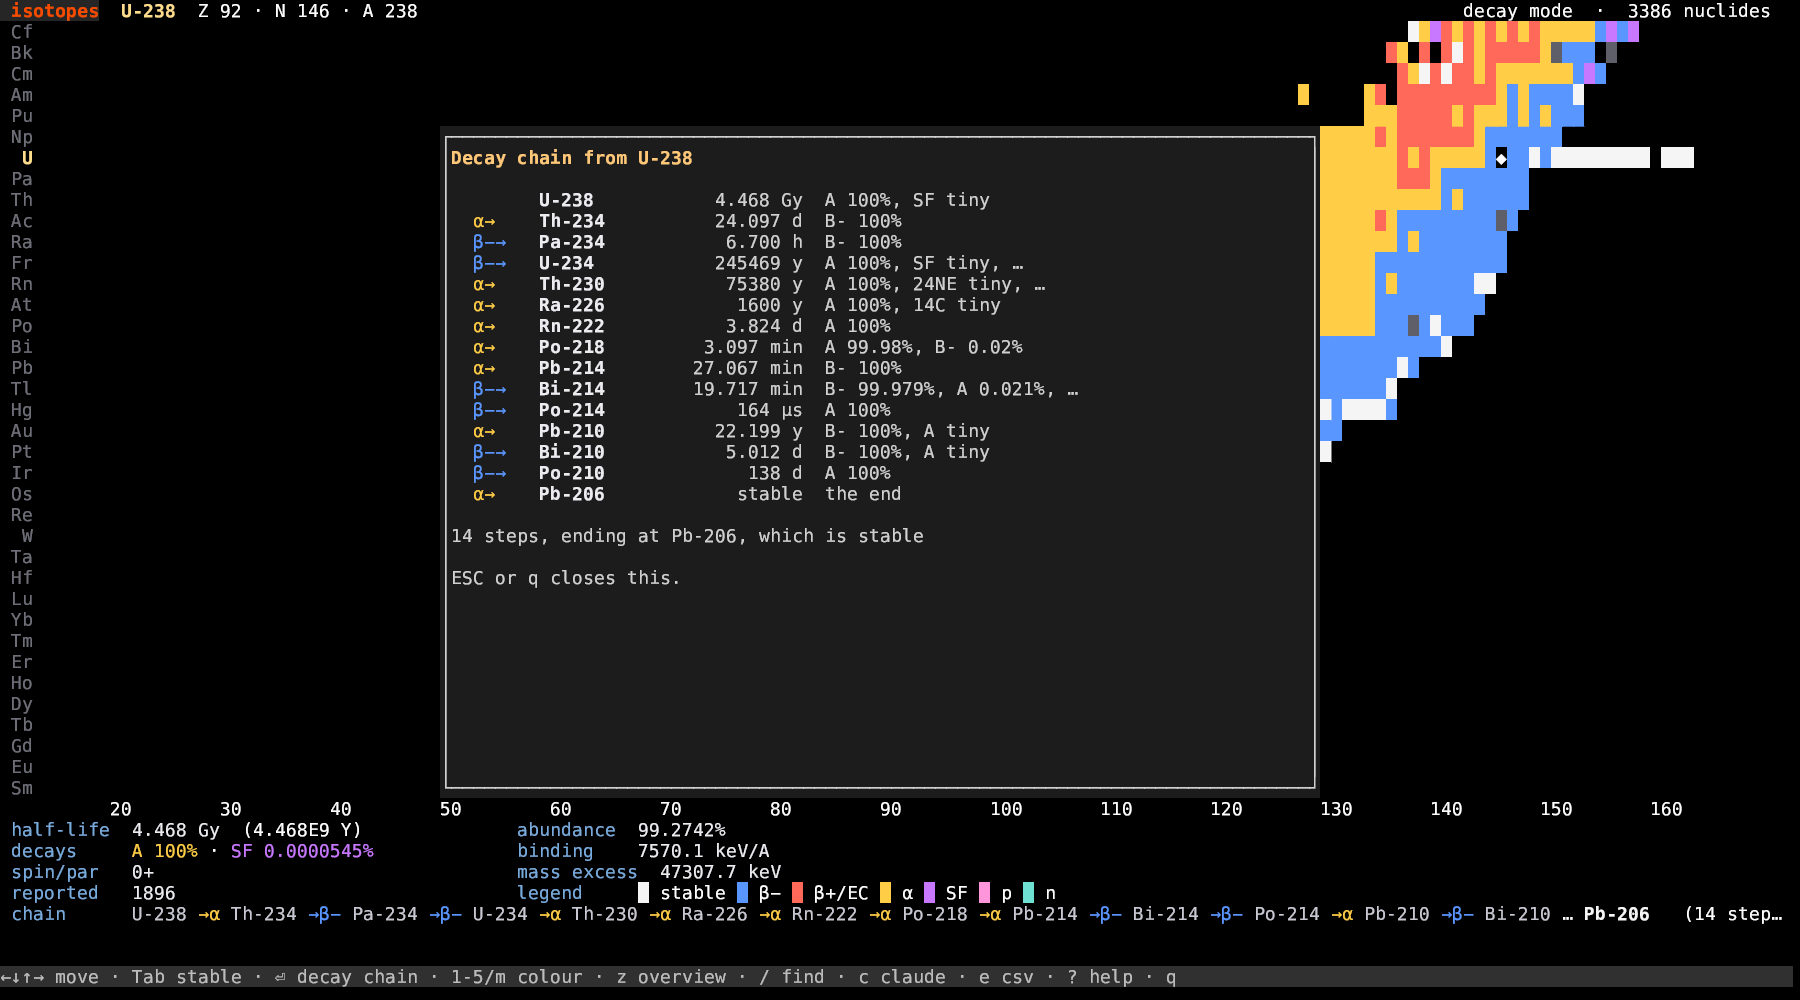
Fourteen steps down to lead-206, every half-life on the way, from 4.468 billion years to 164 microseconds. A chain follows the dominant mode only. Bi-214 splits 99.979 to 0.021 and it takes the big side, but the detail line shows every branch.
The data is the IAEA’s evaluated table: half-lives, decay modes with their branchings, spin and parity, binding energy, mass excess. It ships inside the binary. Press z for all 3,386 at once in braille, eight nuclides per character.
elements knows about it too. Press i on any element and the chart opens on that element’s isotopes.
exoplanets
Every known world outside the solar system. How far out it orbits runs across, how big it is runs up, 6,309 of them.
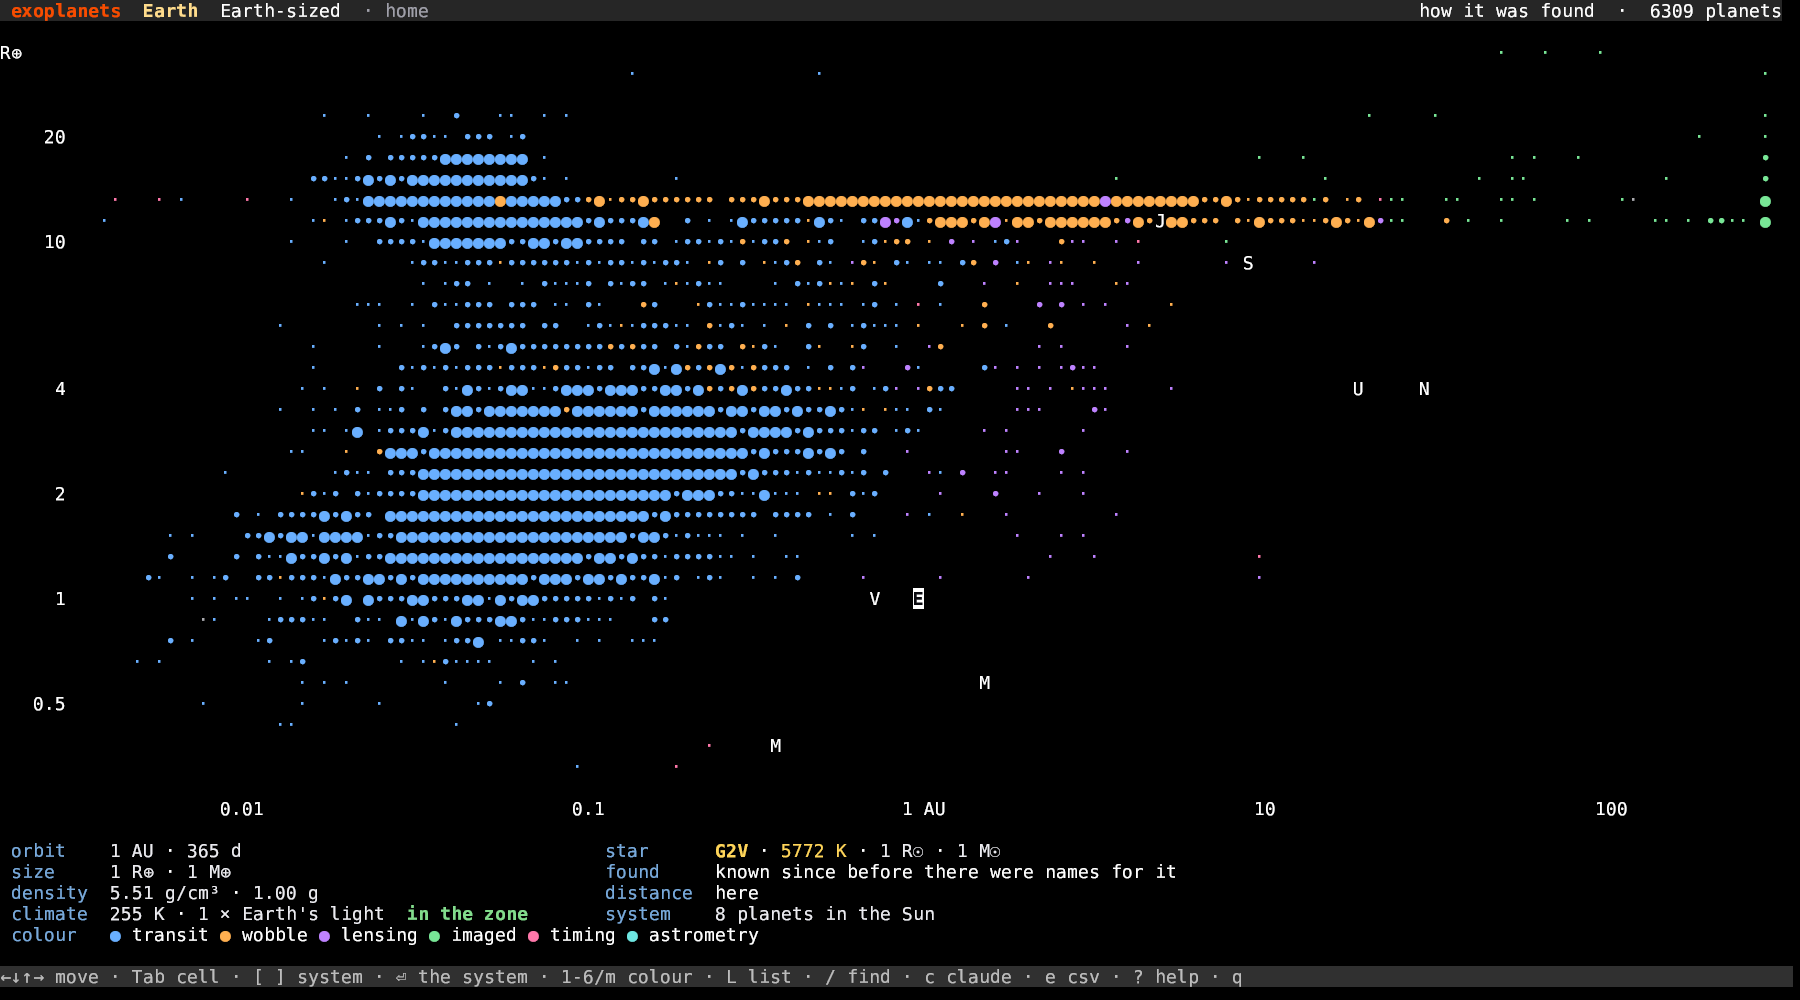
Our own eight are in white for scale, and once you see where they sit the rest of the picture reads itself. Jupiter is out at 5 AU with almost nothing around it. The blue pileup at the top left is hot Jupiters, gas giants closer to their star than Mercury is to ours. Orange is the wobble method, which finds the heavy ones far out. Green at the right edge is direct imaging.
The gap at 1.8 Earth radii is real. Planets avoid it.
Press Enter and the system unfolds.
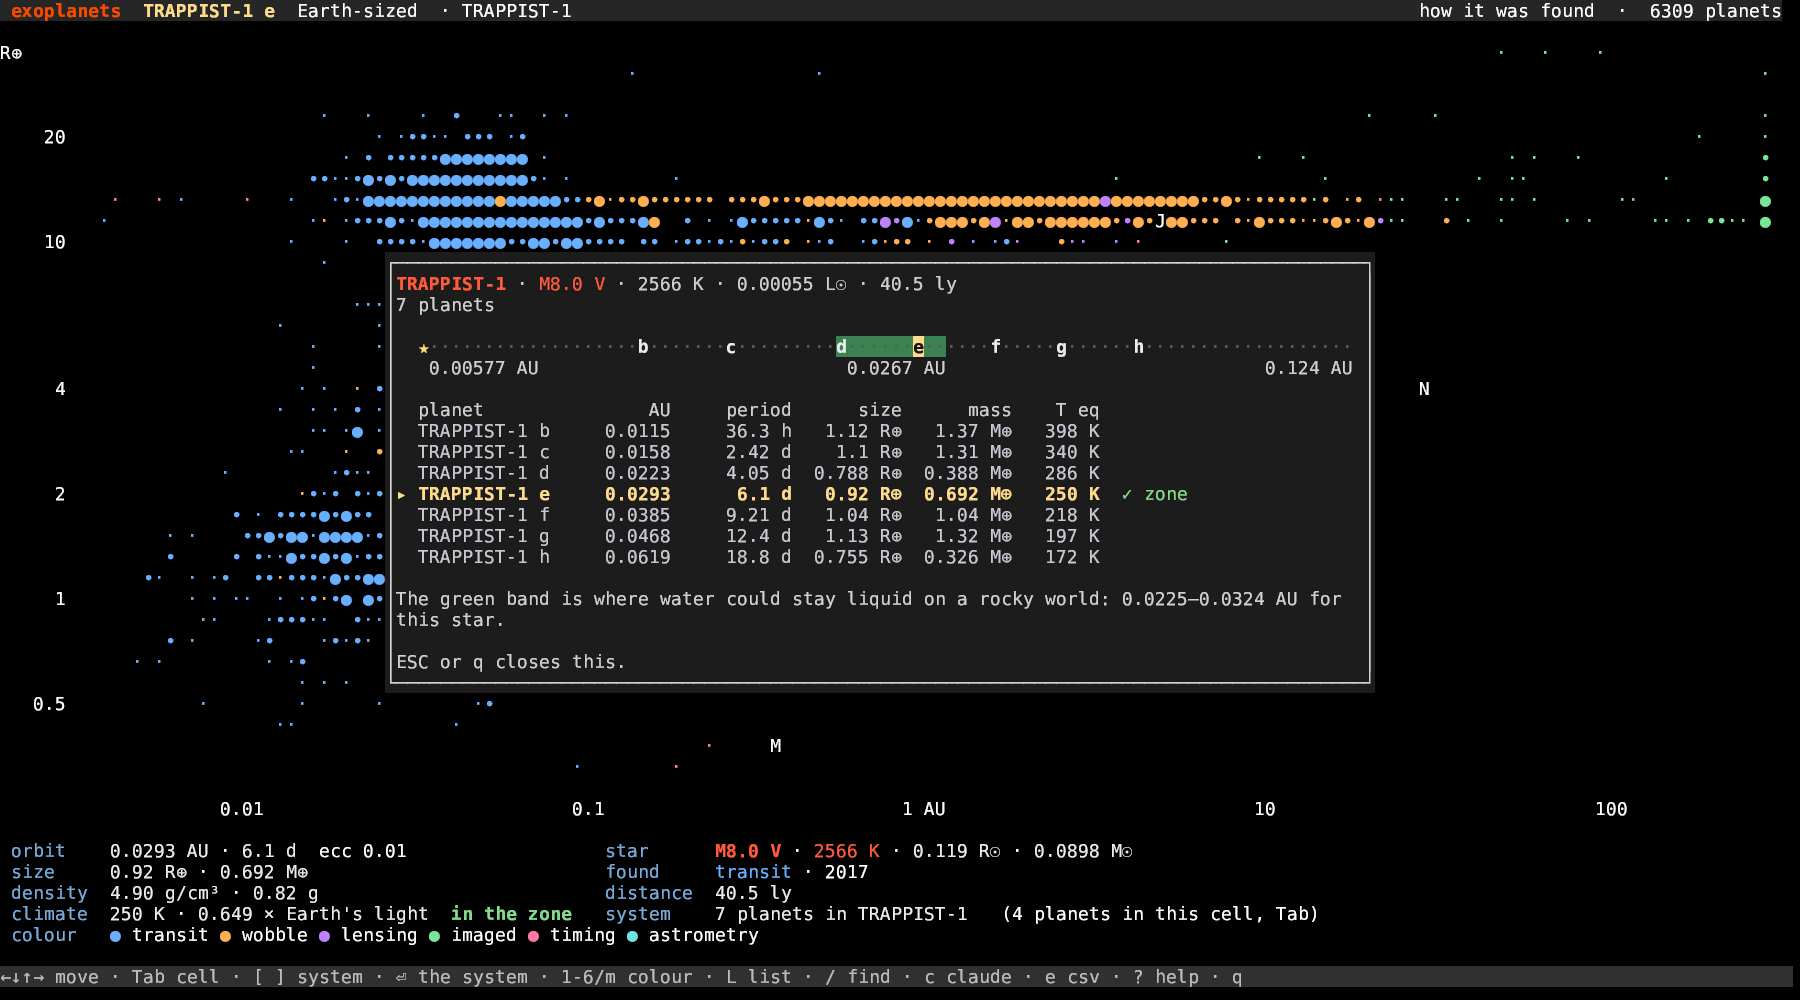
TRAPPIST-1, seven planets around a red dwarf, all of them closer in than Mercury. The green band is where water could stay liquid on a rocky world, worked out from the star’s size and temperature. For that star it lands between 0.0225 and 0.0324 AU, and e sits in it.
Numbers from the NASA Exoplanet Archive. 747 of the orbits came with only a period or only a distance. The app fills in the other with Kepler’s third law and marks it. Without that the microlensing finds would have nowhere to stand.
fractal
Five pictures of one idea: repeat something simple, and watch what it settles into.
If you want the gentle version first: 3Blue1Brown on what a fractal actually is, and Numberphile on the Mandelbrot set.
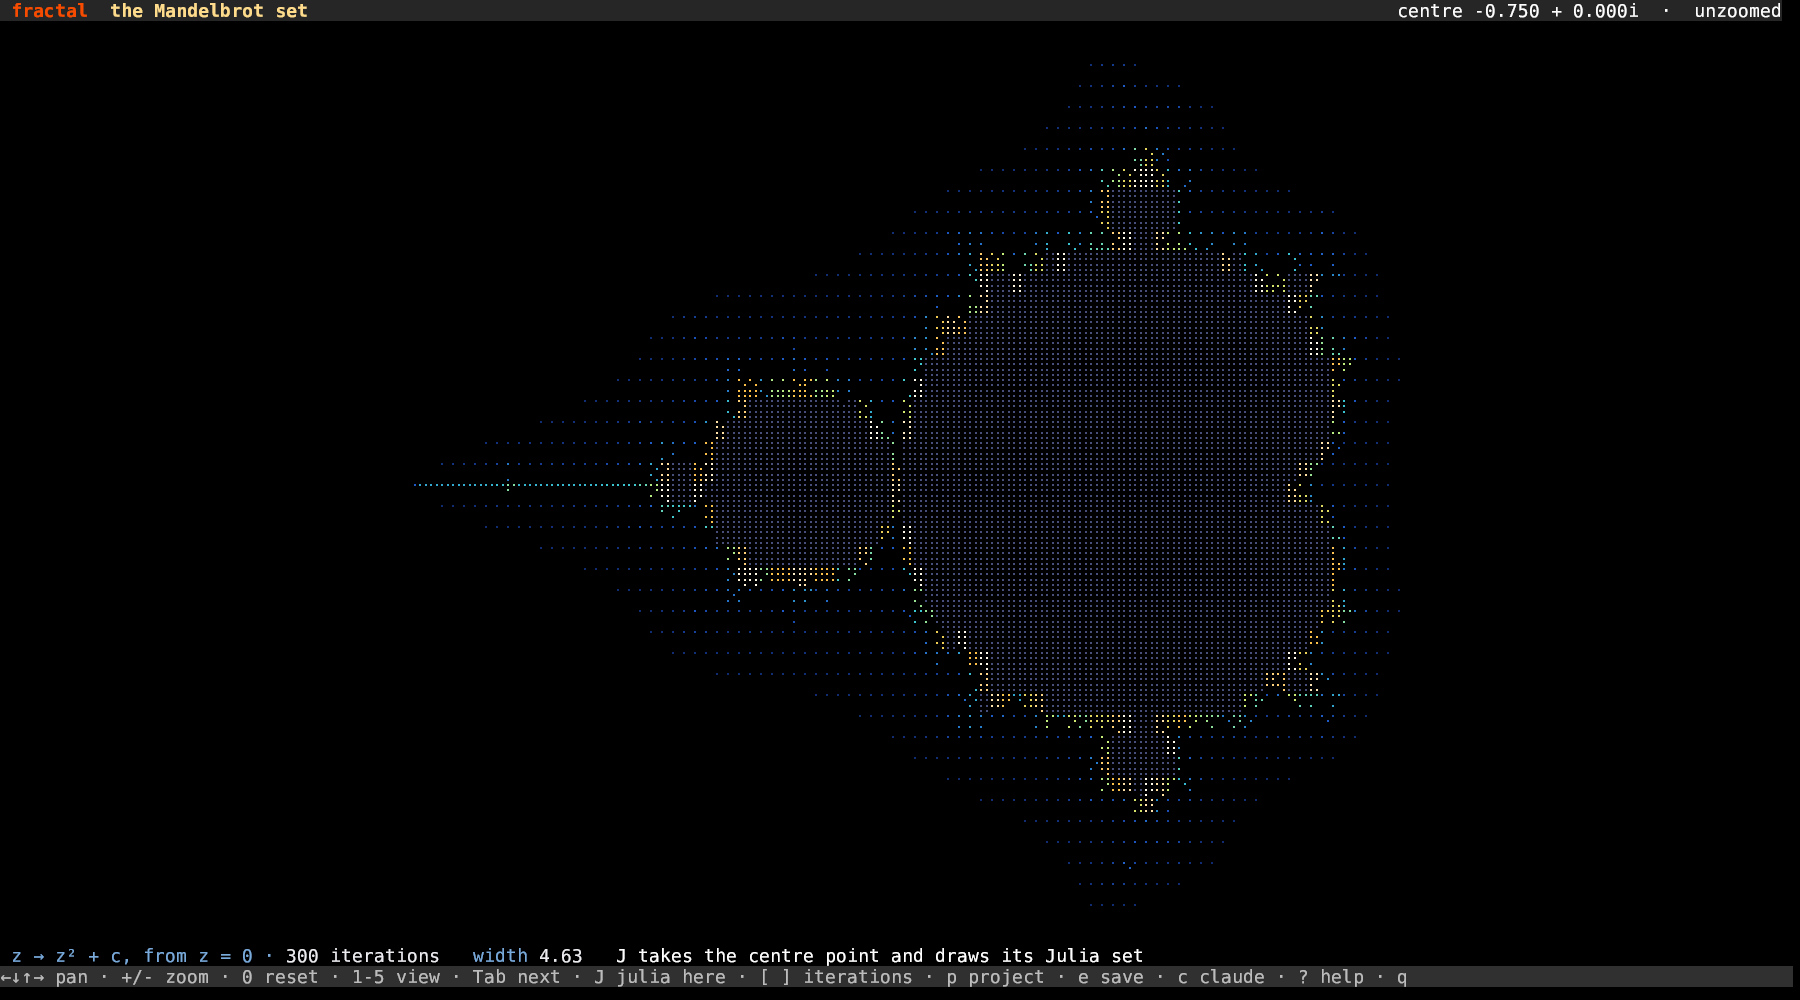
The Mandelbrot set, in braille. Arrows pan, + and - zoom, and the iteration count climbs as you go deeper. Press J and the point you are standing on becomes the c of its own Julia set. Press J again and you are back where you were.
A braille cell is 2x4 dots and one colour, which is a choice. The dots carry eight times the detail, the colour only one value per cell. So the dots are dithered. How many light up inside a cell tracks the value there, and the colour is that cell’s average. Fine structure in the dots, broad shape in the colour.
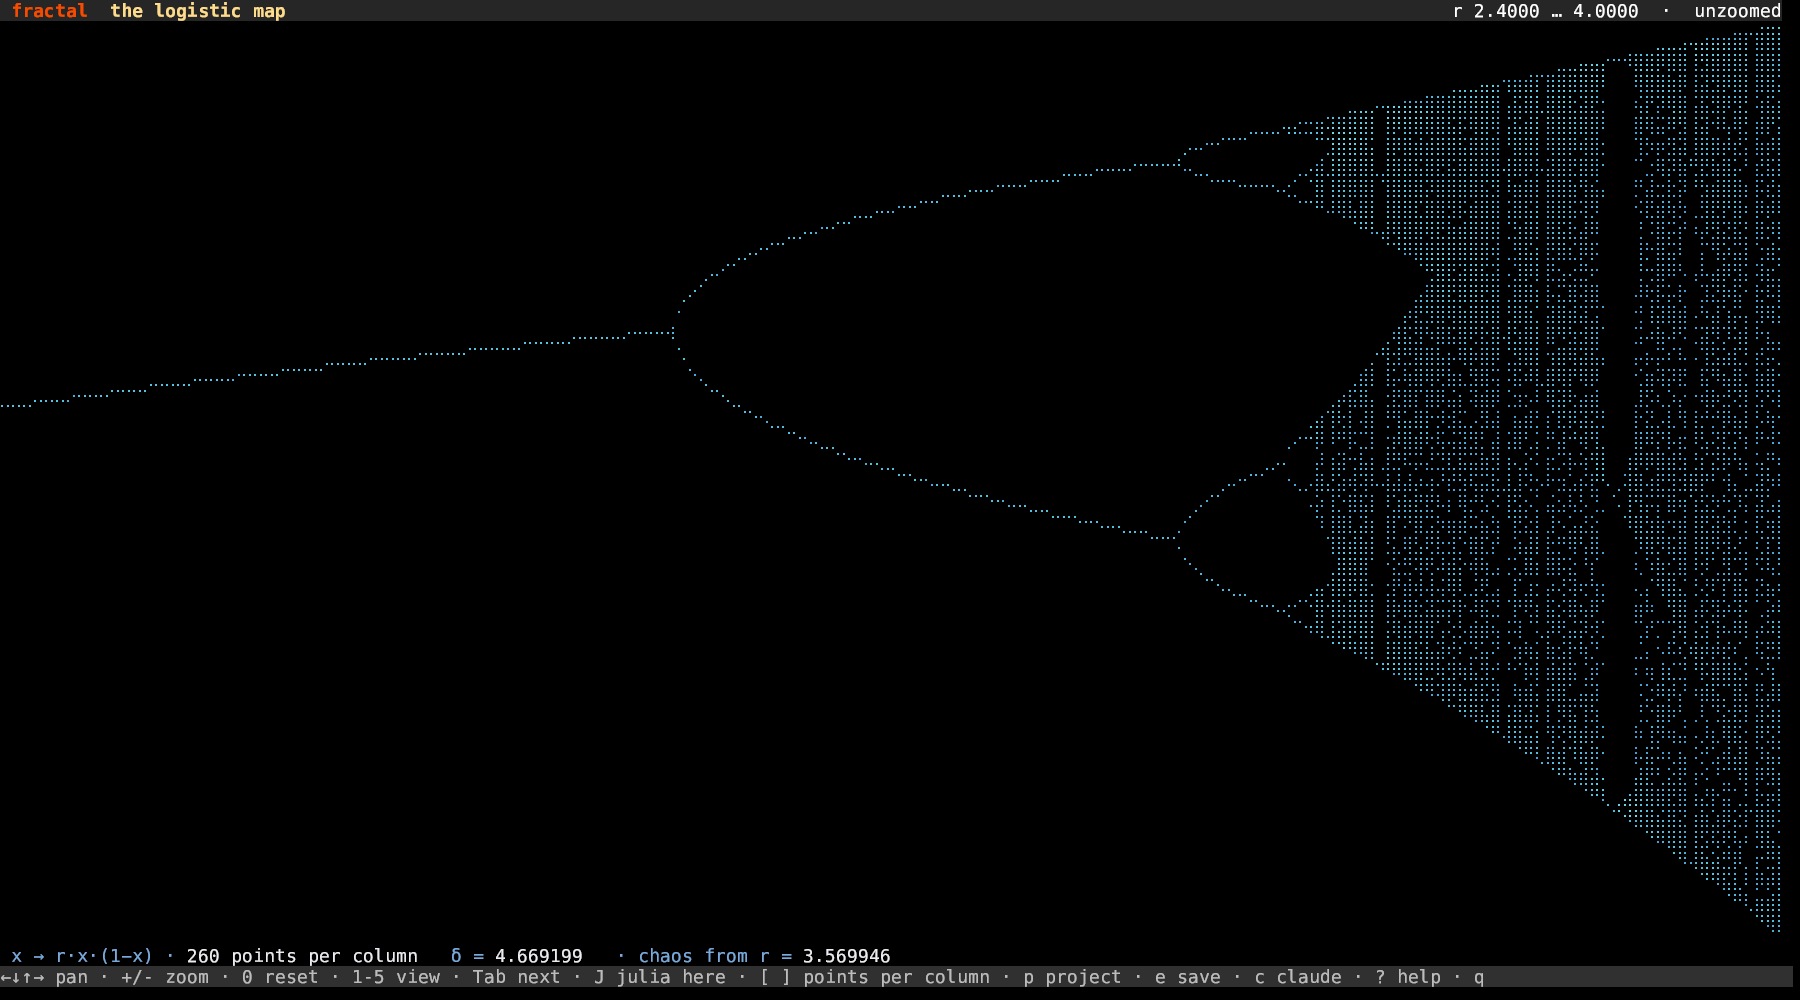
The logistic map. One fixed point, then two, then four, then chaos, with windows of order inside it. δ = 4.669199 and the r = 3.569946 where the doubling gives way are computed while the app runs, not looked up. It hunts the superstable cycles and measures the gaps. Veritasium made a whole film about this one picture.
Then the Lorenz attractor with ρ on a knob, and the Hénon map, 300,000 points folded onto a fractal.
Summary
Three apps, built with Claude. Same rules as the rest of the suite: a single static binary, instant start, everything offline, zero cost when idle. Nothing animates and nothing polls. A frame is drawn when a key asks for one.
Press c in any of them and ask Claude about whatever is on screen, with the numbers as context.
Public Domain, like everything I make.
The science shelf
Seven apps now, covering some 36 orders of magnitude. From a quark, smaller than an attometre, out to a star 500 light-years away.
- astro: the sky tonight, the moon, the planets, your telescope
- stars: the Hertzsprung-Russell diagram
- particles: the Standard Model, down to one quark
- elements: the periodic table
- isotopes: the chart of the nuclides
- exoplanets: the known worlds
- fractal: chaos and fractals
All of them are in the fe2o3 launcher, which will install them for you.
Link to this post: https://isene.org/2026/07/Three-More-Science-Apps.html